What is the statistical significance of India’s win over England in the Dharamsala Test?
178-all!

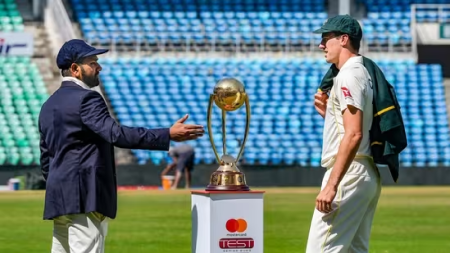
Ninety-one years and eight months since CK Nayudu’s men took the field against England at Lord’s in 1932, representing India in a Test for the first time, the team led by Rohit Sharma achieved a significant milestone by trumping the same opponent in Dharamsala.
Having endured numerous crests and troughs and outgrowing the underdog tag throughout their cricketing history, India’s innings-and-64-run win against the Bazballers was their 178th win in their 579th Test appearance.
While ‘178’ as a number may not necessarily stand out in itself, the triumph pulled India’s wins level with the number of losses for the first time in their Test history –- the win-loss ratio now stands at 1 after 314 cricketers have spent 2,673 days on the field for the country.
Laggards to contenders
Registering their first Test victory took India 25 Tests and 20 years. After playing England, Australia and West Indies – for 12 losses and as many draws – India notched up an innings and six-run victory over England in Madras under the leadership of the legendary Vijay Hazare on February 10, 1952.
By their 10th Test win, India had played 94 Tests. The W/L ratio remained lopsided for a fledgling Indian team after 100 Tests – reeling at 0.25 with 10 wins, 40 losses, and 50 draws.A maiden overseas win came in Dunedin against New Zealand in 1968 as spin stalwarts Erapalli Prasanna and Bishan Singh Bedi also propelled India to their first overseas series win by a 3-1 margin.
| Win-Loss ratio in Tests in 20th century (1901-2000) | |||||||
|
Team |
Span |
Mat |
Won |
Lost |
Tied |
Draw |
W/L |
|
Australia |
1901-2000 |
554 |
244 |
142 |
2 |
166 |
1.718 |
|
West Indies |
1928-2000 |
368 |
138 |
100 |
1 |
129 |
1.38 |
|
Pakistan |
1952-2000 |
273 |
77 |
66 |
0 |
130 |
1.166 |
|
England |
1901-2000 |
712 |
228 |
203 |
0 |
281 |
1.123 |
|
South Africa |
1902-2000 |
241 |
73 |
84 |
0 |
84 |
0.869 |
|
India |
1932-2000 |
336 |
63 |
112 |
1 |
160 |
0.562 |
|
Sri Lanka |
1982-2000 |
106 |
19 |
42 |
0 |
45 |
0.452 |
|
New Zealand |
1930-2000 |
285 |
46 |
116 |
0 |
123 |
0.396 |
However, such instances remained rare for a developing Indian side that showed the ability to punch above their weight only in patches. India remained a middling team, ranked sixth-best in the world in the 20th century. Pakistan and South Africa, who played considerably fewer games than India during this period, recorded more wins. As of December 31, 2000 – India had played 336 Tests for 63 wins with a W/L percentage of 0.58.
India were also not known to be the dominant team at home that they are now. It took 150 Tests (36-35) at home for India’s wins to outnumber their losses. The W/L ratio eventually stood at 1.166 (in 179 home Tests) at the end of the 20th century – with Pakistan (2.529), West Indies (2.444) and Australia (2.140) leading the charts in that regard.
For a 25-Test cut-off, India were also the poorest touring team, having won just 14 out of the 157 Tests played, a pitiful W/L ratio of 0.20.
Most successful Test teams
|
Team |
Span |
Matches |
Won |
Lost |
Tied |
Draw |
W/L |
|
Australia |
1877-2024 |
866 |
413 |
232 |
2 |
218 |
1.78 |
|
England |
1877-2024 |
1071 |
392 |
324 |
0 |
355 |
1.209 |
|
West Indies |
1928-2024 |
575 |
183 |
210 |
1 |
181 |
0.871 |
|
India |
1932-2024 |
579 |
178 |
178 |
1 |
222 |
1 |
|
South Africa |
1889-2024 |
464 |
178 |
161 |
0 |
125 |
1.105 |
|
Pakistan |
1952-2024 |
456 |
148 |
142 |
0 |
166 |
1.042 |
|
New Zealand |
1930-2024 |
470 |
115 |
184 |
0 |
170 |
0.625 |
|
Sri Lanka |
1982-2024 |
314 |
101 |
121 |
0 |
92 |
0.834 |
Era of domination
However, the 21st century brought about a remarkable uptick in India’s Test fortunes. In these 23 years, India have won 115 of 243 Tests and stands second among all teams, only behind Australia.
The dramatic turnaround has largely been fuelled by their dominant run in home conditions, where they boast an astounding win percentage of 62.7 in 110 matches, with only Australia ahead of them. India have also won 46 matches in 131 outings overseas since 2001, only bettered by Australia again.
While progress was made in the 2000-09 decade, India surged to the top spot over Australia from the start of 2010, both at home and away – with 77 wins from 142 matches – amassing a W/L ratio of 1.833.
Win-Loss ratio in Tests in last 10 years
| Team | Span | Mat | Won | Lost | Tied | Draw | W/L |
| India | 2014-2024 | 101 | 57 | 27 | 0 | 17 | 2.111 |
| Australia | 2014-2024 | 99 | 53 | 29 | 0 | 16 | 1.827 |
| New Zealand | 2014-2024 | 79 | 40 | 26 | 0 | 12 | 1.538 |
| South Africa | 2014-2024 | 80 | 38 | 32 | 0 | 10 | 1.187 |
| England | 2014-2024 | 126 | 56 | 51 | 0 | 19 | 1.098 |
| Pakistan | 2014-2024 | 76 | 30 | 35 | 0 | 11 | 0.857 |
| Sri Lanka | 2014-2024 | 87 | 33 | 40 | 0 | 14 | 0.825 |
| West Indies | 2014-2024 | 80 | 23 | 44 | 0 | 13 | 0.522 |
| Bangladesh | 2014-2023 | 57 | 15 | 35 | 0 | 7 | 0.428 |
A pivotal phase in India’s resurgence came when MS Dhoni passed the reins of the Test side to Virat Kohli. Between 2014 and 2020, Kohli led India to 40 wins in 68 Tests with a 58.82 win percentage. Since taking over captaincy in 2022, Rohit has also had a positive record, with 10 wins in 16 matches.
The win in Dharamsala may only be a transient number on India’s Test profile in the long term. However, the result of the fifth Test will be remembered for the success of a largely young team and a significant intersection of memorable wins and defeats as India enter an era where they will undoubtedly be regarded as a long-format superpower.
India’s milestone victories
- 1st win: v England, February 1952 – Chennai
- 50th win: v Sri Lanka, January 1994 – Lucknow
- 100th win: v Sri Lanka, November 2009 – Kanpur
- 150th win: v Australia, December 2020 – Melbourne
- 178th win: v England, March 2023 – Dharamsala
India’s result progression
- After 25 Tests – Won: 1, Loss: 12, Draw: 12
- After 100 Tests – Won: 10, Loss: 40, Draw: 50
- After 200 Tests – Won: 35, Loss: 72, Draw: 93, Tied: 1
- After 300 Tests – Won: 56, Loss: 98, Draw: 145, Tied: 1
- After 400 Tests – Won: 88, Loss: 129, Draw: 182, Tied: 1
- After 500 Tests – Won: 130, Loss: 157, Draw: 212, Tied: 1
After 579 Tests – Won: 178, Loss: 178, Draw: 222, Tied: 1
- Home (289 matches) – Won: 118, Loss: 55, Draw: 115, Tied: 1
- Away (290 matches) – Won: 60, Loss: 123, Draw: 107
Players part of most Test wins
- 72 – Sachin Tendulkar
- 59 = Virat Kohli, R. Ashwin
- 58 – Rahul Dravid
- 56 – Cheteshwar Pujara
Most runs in won Tests
- 5946 – Sachin Tendulkar
- 5131 – Rahul Dravid
- 4542 – Virat Kohli
Most wickets in won Tests
- 363 – R. Ashwin
- 288 – Anil Kumble
- 221 – Harbhajan Singh
- 211 – Ravindra Jadeja
Disclaimer: The copyright of this article belongs to the original author. Reposting this article is solely for the purpose of information dissemination and does not constitute any investment advice. If there is any infringement, please contact us immediately. We will make corrections or deletions as necessary. Thank you.
Read More
WTC points table 2023-25: Why India with 74 points are first and Australia with 90 points second?
The ICC World Test Championship (WTC) 2023-25 points table had a brief shakeup over the last two wee...
New feud brewing in Pakistan? Wasim Akram hits back at Shaheen Afridi after ‘shush’ celebration
Legendary Pakistan cricketer Wasim Akram has hit back on Shaheen Shah Afridi after Lahore Qalandars ...
‘Rishabh Pant’s full-time Delhi Capitals captaincy will depend on his fitness,’ says head coach Ponting ahead of IPL 2024
Rishabh Pant’s much-awaited return to competitive cricket is set to be put in motion later this mont...
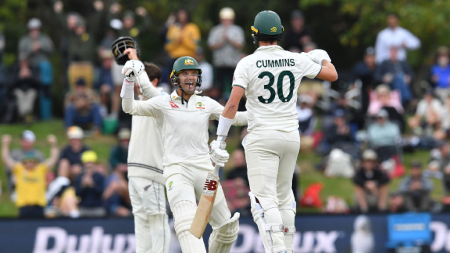
80-5 to 281-7: Carey, Cummins, Marsh extend New Zealand’s 31-year wait for home Test win against Australia
In a pulsating Day 4 chase on Monday, Australia pipped New Zealand by three wickets to whitewash the...
Blackcaps v Australia: Early dropped catch proves costly as Australia hold on for test victory over New Zealand in Christchurch
An unbeaten 98 from Alex Carey and a crucial dropped catch by Rachin Ravindra have proved to be the ...

Klopp, Guardiola, Arteta: Premier League’s equivalent of the Big 3
Just like that, with a handshake and a hug, ended the rivalry that defined the English Premier Leagu...